

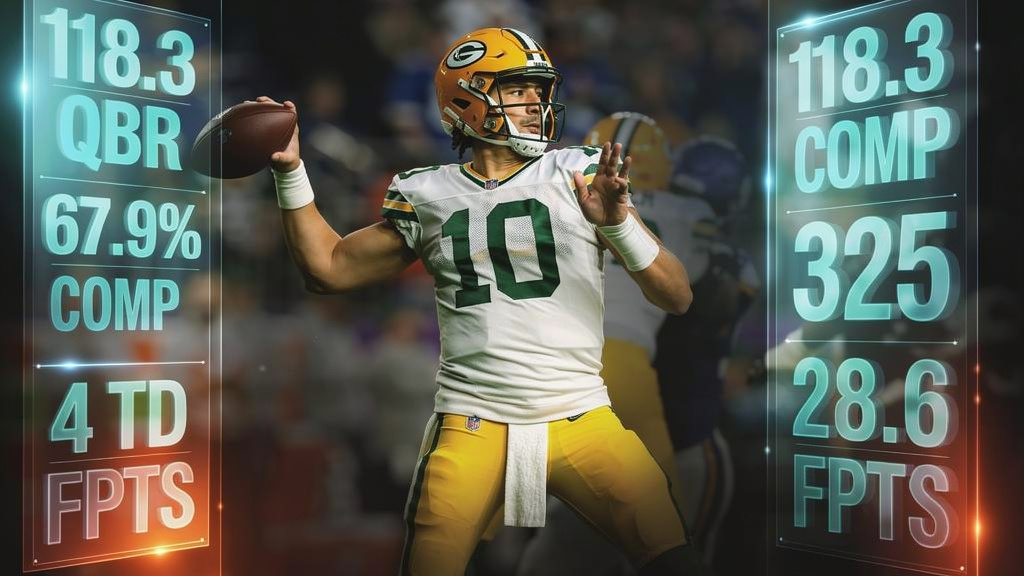
The Heat Sheet: Week 1 Season Pass Edition
The Full 5x MapThe Heat Sheet is built around one question:
Which players have already demonstrated the kind of salary-adjusted ceiling capable of breaking a tournament slate?
A 4x performance is important because it represents major tournament upside. But 5x is the extreme outcome.
That's where a player delivers five fantasy points for every $1,000 of his current DraftKings salary. Those are the performances that can completely change the shape of a large-field tournament.
The goal isn't to predict who will reach 5x this week. It's to identify where that level of upside has already existed and determine how strong the historical evidence really is.
For every player, we're looking at:
- Current DraftKings salary
- Current projection
- 5x target
- Historical 5x hits
- 5x Hit Rate
- Games played and sample size
- How that rate compares with the position
- Supporting 4x history when it adds useful context
The Week 1 Baseline
A 5x Hit Rate means more when we know what's typical at the position.
For Week 1, the positional comparison points are:
Position Median 5x Hit Rate QB 8% RB 6% WR 6% TE ~7% That changes how we read the numbers.
A 12% rate at wide receiver is roughly double the WR median. A quarterback at 6% has demonstrated 5x upside, but his rate still sits below the QB baseline.
The percentage alone isn't enough either. Three 5x hits over 16 games carry more weight than one hit over four games.
With that context, here's where the Week 1 heat actually lives.
Quarterback Heat
Quarterback has a clear group at the top of the historical 5x board.
Jordan Love (GB) $5,700
Projection: 16.46
5x Target: 28.5
5x Hits: 3
5x Hit Rate: 19%
QB Median: 8%
Love's 19% rate is more than twice the quarterback median, and it comes from three actual 5x performances across 16 games.
His 4x history supports the same story, with four qualifying games.
The 28.5-point target sits well above his current projection, but that's exactly what we're measuring. Projection tells us what's expected. His history shows us how far beyond expectation he has already traveled.
Heat Read: Strong Historical Heat
Justin Herbert (LAC) $6,100
Projection: 19.73
5x Target: 30.5
5x Hits: 3
5x Hit Rate: 18%
QB Median: 8%
Herbert owns three 5x performances across 17 games.
He also has five 4x hits, which gives the extreme ceiling additional support.
The combination of 18% 5x frequency, three actual hits and a 17-game sample makes this one of the strongest quarterback profiles on the board.
Heat Read: Strong Historical Heat
Josh Allen (BUF) $7,000
Projection: 20.98
5x Target: 35
5x Hits: 3
5x Hit Rate: 17%
QB Median: 8%
Allen's target is much harder to reach because of his salary.
A 35-point DraftKings performance is a monster score, yet he's reached that salary-adjusted threshold three times in 18 games.
That's what makes his 17% rate notable.
Cheap quarterbacks can reach 5x with much smaller raw fantasy scores. Allen has demonstrated the same type of return while carrying premium pricing.
Heat Read: Premium Ceiling
Geno Smith (NYJ) $4,600
Projection: 14.30
5x Target: 23
5x Hits: 2
5x Hit Rate: 13%
QB Median: 8%
Geno's appeal comes from the combination of price and history.
His 23-point target is much more manageable than the targets attached to the premium quarterbacks, and he's cleared it twice across 15 games.
His 13% rate also sits comfortably above the quarterback median.
Heat Read: Salary-Relief Heat
Bryce Young (CAR) $5,200
Projection: 16.03
5x Target: 26
5x Hits: 2
5x Hit Rate: 12%
QB Median: 8%
Young has two 5x hits in 17 games and four 4x performances.
The rate isn't as strong as Love, Herbert or Allen, but it's still above the positional median with enough games behind it to be meaningful.
Heat Read: Above-Median Ceiling
Trevor Lawrence (JAX) $5,800
Projection: 19.01
5x Target: 29
5x Hits: 2
5x Hit Rate: 11%
QB Median: 8%
Lawrence has two 5x hits across 18 games along with five 4x performances.
His 5x rate isn't dominant, but the combination of repeated extreme hits and strong 4x support keeps him in the conversation.
Heat Read: Supported Ceiling
QB Heat Sheet
Player Salary Projection 5x Target 5x Hits 5x Rate Pos. Median Heat Read Malik Willis (MIA) $5,300 16.92 26.5 1 25% 8% ⚠️ Four-game sample Jordan Love (GB) $5,700 16.46 28.5 3 19% 8% 🔥 Strong Justin Herbert (LAC) $6,100 19.73 30.5 3 18% 8% 🔥 Strong Josh Allen (BUF) $7,000 20.98 35.0 3 17% 8% 🔥 Premium Geno Smith (NYJ) $4,600 14.30 23.0 2 13% 8% 🔥 Salary Heat Bryce Young (CAR) $5,200 16.03 26.0 2 12% 8% 🔥 Above Median Trevor Lawrence (JAX) $5,800 19.01 29.0 2 11% 8% 👀 Supported Tua Tagovailoa (ATL) $4,800 14.09 24.0 1 11% 8% 👀 Smaller sample Daniel Jones (IND) $5,400 17.88 27.0 1 8% 8% 👀 Strong 4x history Jacoby Brissett (ARI) $5,100 14.76 25.5 1 8% 8% 👀 Strong 4x history Jared Goff (DET) $6,000 18.91 30.0 1 6% 8% Below Median Baker Mayfield (TB) $5,900 18.66 29.5 1 6% 8% Thin 5x History Caleb Williams (CHI) $6,300 18.79 31.5 1 5% 8% Below Median QB Bottom Line
Love, Herbert and Allen provide the strongest combination of repeated 5x hits, above-median frequency and meaningful sample size.
Geno offers the most interesting salary-relief profile.
Malik Willis has the highest rate, but four games simply isn't enough history to treat 25% the same way we treat Love's 19% across 16 games.
Running Back Heat
The RB median is 6%, and the strongest reliable 5x history is concentrated near the top of the salary scale.
Gibbs (DET) $8,000
Projection: 24.16
5x Target: 40
5x Hits: 2
5x Hit Rate: 12%
RB Median: 6%
A 40-point target is the largest hurdle among the featured running backs.
Gibbs has still reached it twice across 17 games.
His 12% rate is double the RB median, and four 4x performances provide additional evidence of high-end ceiling.
Heat Read: Premium Heat
Robinson (ATL) $7,700
Projection: 23.25
5x Target: 38.5
5x Hits: 2
5x Hit Rate: 12%
RB Median: 6%
Robinson matches Gibbs with two 5x hits across 17 games.
His five 4x performances strengthen the overall ceiling profile.
Heat Read: Premium Heat
Taylor (IND) $7,300
Projection: 19.61
5x Target: 36.5
5x Hits: 2
5x Hit Rate: 12%
RB Median: 6%
Taylor also sits at double the positional median with two 5x hits.
What separates him slightly is the supporting 4x history: six 4x hits across 17 games, the strongest volume among this premium trio.
Heat Read: Premium Heat
Gainwell (TB) $5,200
Projection: 11.82
5x Target: 26
5x Hits: 2
5x Hit Rate: 11%
RB Median: 6%
Gainwell gives us a different type of profile.
The projection isn't particularly strong, but his historical rate is nearly twice the RB median and is backed by two actual 5x games.
His four 4x hits also show that the high-end outcomes weren't limited to two isolated performances.
Heat Read: Salary-Relief History
RB Heat Sheet
Player Salary Projection 5x Target 5x Hits 5x Rate Pos. Median Heat Read Gibbs (DET) $8,000 24.16 40.0 2 12% 6% 🔥 Premium Robinson (ATL) $7,700 23.25 38.5 2 12% 6% 🔥 Premium Taylor (IND) $7,300 19.61 36.5 2 12% 6% 🔥 Premium Jeanty (LV) $6,600 10.02 33.0 2 12% 6% ⚠️ Projection concern Gainwell (TB) $5,200 11.82 26.0 2 11% 6% 👀 Salary Heat Achane (MIA) $7,000 17.46 35.0 1 6% 6% At Median Barkley (PHI) $6,900 18.27 34.5 1 6% 6% At Median Henry (BAL) $6,700 16.68 33.5 1 6% 6% 4x Support Etienne (NO) $5,900 16.42 29.5 1 6% 6% At Median Warren (PIT) $5,400 14.34 27.0 1 6% 6% Salary Option Cook (BUF) $7,200 16.92 36.0 1 5% 6% Below Median RB Bottom Line
Week 1 running back heat is concentrated at the top.
Gibbs, Robinson and Taylor each own two 5x hits at a 12% rate across 17-game samples.
Jeanty's historical number matches them, but the gap between his 10.02 projection and 33-point 5x target makes his current profile much harder to embrace strictly from the Heat Sheet.
Wide Receiver Heat
Wide receiver provides the deepest collection of above-median 5x profiles.
The positional median is just 6%, giving us several players who have historically reached the extreme ceiling at two or even three times the normal rate.
Wan'Dale Robinson (TEN) $4,800
Projection: 11.28
5x Target: 24
5x Hits: 3
5x Hit Rate: 19%
WR Median: 6%
Three 5x performances across 16 games give Robinson one of the strongest salary-adjusted ceiling records at the position.
His 19% rate is more than three times the WR median.
He also owns four 4x hits, so the ceiling isn't built entirely around three isolated games.
Heat Read: Strong Salary-Relief Heat
Drake London (ATL) $6,500
Projection: 17.11
5x Target: 32.5
5x Hits: 2
5x Hit Rate: 17%
WR Median: 6%
London's rate is nearly three times the positional median.
His four 4x performances across 12 games provide particularly strong supporting evidence.
Heat Read: Strong Historical Heat
Quentin Johnston (LAC) $4,700
Projection: 11.02
5x Target: 23.5
5x Hits: 2
5x Hit Rate: 15%
WR Median: 6%
Johnston combines a relatively low target with repeated historical ceiling.
Two 5x hits in 13 games put him at two and a half times the WR median.
Heat Read: Salary-Relief Heat
Ja'Marr Chase (CIN) $7,800
Projection: 23.55
5x Target: 39
5x Hits: 2
5x Hit Rate: 13%
WR Median: 6%
Chase's raw target is the key.
Thirty-nine DraftKings points is an enormous score, yet he's produced it twice under this week's salary-adjusted standard.
That's more than double the positional median despite one of the hardest thresholds at WR.
Heat Read: Premium Ceiling
Amon-Ra St. Brown (DET) $7,500
Projection: 19.98
5x Target: 37.5
5x Hits: 2
5x Hit Rate: 13%
WR Median: 6%
St. Brown produces almost the same profile as Chase:
Two historical 5x hits, a 13% rate and a target approaching 40 points.
Heat Read: Premium Ceiling
Michael Wilson (ARI) $5,300
Projection: 11.32
5x Target: 26.5
5x Hits: 2
5x Hit Rate: 12%
WR Median: 6%
Wilson sits exactly at twice the WR median with two 5x performances across 17 games.
Three 4x hits provide useful support.
Heat Read: Above-Median Heat
Xavier Hutchinson (HOU) $3,200
Projection: 7.13
5x Target: 16
5x Hits: 2
5x Hit Rate: 12%
WR Median: 6%
This is one of the more interesting pure salary profiles.
A $3,200 salary lowers the 5x target to only 16 points, and Hutchinson has cleared that mark twice across 17 games.
The projection is modest, but the historical salary-adjusted ceiling is real.
Heat Read: Deep Salary Relief
WR Heat Sheet
Player Salary Projection 5x Target 5x Hits 5x Rate Pos. Median Heat Read Wan'Dale Robinson (TEN) $4,800 11.28 24.0 3 19% 6% 🔥 Strong Salary Heat Drake London (ATL) $6,500 17.11 32.5 2 17% 6% 🔥 Strong Quentin Johnston (LAC) $4,700 11.02 23.5 2 15% 6% 🔥 Salary Heat Travis Hunter (JAX) $3,400 3.34 17.0 1 14% 6% ⚠️ Projection concern Ja'Marr Chase (CIN) $7,800 23.55 39.0 2 13% 6% 🔥 Premium Amon-Ra St. Brown (DET) $7,500 19.98 37.5 2 13% 6% 🔥 Premium Michael Wilson (ARI) $5,300 11.32 26.5 2 12% 6% 🔥 Above Median Xavier Hutchinson (HOU) $3,200 7.13 16.0 2 12% 6% 🔥 Deep Salary Heat Chris Godwin (TB) $5,200 11.87 26.0 1 11% 6% 👀 Above Median Jalen Coker (CAR) $4,600 9.16 23.0 1 9% 6% 👀 Above Median Rome Odunze (CHI) $5,400 12.92 27.0 1 8% 6% 👀 Above Median Jalen Nailor (LV) $4,300 9.43 21.5 1 8% 6% 👀 4x Support Andrei Iosivas (CIN) $3,300 6.01 16.5 1 8% 6% 👀 Cheap History Tee Higgins (CIN) $6,300 14.76 31.5 1 7% 6% Slightly Above Alec Pierce (IND) $5,700 8.75 28.5 1 7% 6% Projection Concern Chris Olave (NO) $6,700 15.02 33.5 1 6% 6% Strong 4x Support DeVonta Smith (PHI) $6,600 16.02 33.0 1 6% 6% At Median Zay Flowers (BAL) $6,400 14.69 32.0 1 6% 6% At Median Emeka Egbuka (TB) $6,200 14.70 31.0 1 6% 6% At Median Parker Washington (JAX) $5,600 11.93 28.0 1 6% 6% 4x Support WRs With Strong 4x History But No 5x Hit
A zero in the 5x column doesn't mean a player lacks tournament upside.
Several receivers have repeatedly reached 4x without getting all the way to this week's 5x requirement:
- Michael Pittman Jr. (PIT): 4 4x hits, 24%
- Jauan Jennings (MIN): 4 hits, 24%
- Jameson Williams (DET): 3 hits, 20%
- Khalil Shakir (BUF): 3 hits, 17%
- Christian Watson (GB): 2 hits, 18%
- DK Metcalf (PIT): 2 hits, 13%
- Ladd McConkey (LAC): 2 hits, 12%
These aren't 5x leaders, but their histories show that substantial tournament ceiling still exists.
WR Bottom Line
Wide receiver offers the widest range of ways to access 5x history.
There are premium options, mid-range options and several salary-relief profiles with rates well above the 6% positional median.
That's what makes WR the deepest Heat Sheet position in Week 1.
Tight End Heat
Tight end has one of the most interesting mixes of ceiling and salary relief.
The positional median sits around 7%, while several players have doubled that rate.
Tucker Kraft (GB) $4,500
Projection: 10.85
5x Target: 22.5
5x Hits: 2
5x Hit Rate: 25%
TE Median: ~7%
Kraft owns the highest 5x rate among the primary tight end names.
But it comes from only eight games.
The signal is real. The confidence level needs to reflect the sample.
Heat Read: Strong Rate, Smaller Sample
Dalton Schultz (HOU) $3,400
Projection: 8.26
5x Target: 17
5x Hits: 3
5x Hit Rate: 16%
TE Median: ~7%
Schultz may have the strongest complete 5x profile at tight end.
He owns:
- Three actual 5x hits
- A 16% rate
- 19 games of history
- Five supporting 4x performances
- A manageable 17-point 5x target
Kraft owns the larger percentage.
Schultz owns the stronger volume of evidence.
Heat Read: Strong Historical Heat
Mason Taylor (NYJ) $2,800
Projection: 4.46
5x Target: 14
5x Hits: 2
5x Hit Rate: 15%
TE Median: ~7%
Taylor's 15% rate is more than twice the positional median and is backed by two hits across 13 games.
The problem is the gap between his current projection and the 14-point target.
The history demands attention. The current expectation demands caution.
Heat Read: Historical Heat With Projection Risk
Dallas Goedert (PHI) $4,100
Projection: 10.37
5x Target: 20.5
5x Hits: 2
5x Hit Rate: 13%
TE Median: ~7%
Goedert offers one of the more balanced tight end profiles.
He has two 5x hits and five 4x performances across 16 games.
That combination gives the 13% extreme-ceiling rate substantial support.
Heat Read: Strong Historical Heat
Colston Loveland (CHI) $5,300
Projection: 12.18
5x Target: 26.5
5x Hits: 2
5x Hit Rate: 12%
TE Median: ~7%
Loveland has reached 5x twice across 17 games and 4x four times.
The 26.5 target is considerably higher than the cheaper tight ends must reach, making the repeated hits notable.
Heat Read: Supported Ceiling
TE Heat Sheet
Player Salary Projection 5x Target 5x Hits 5x Rate Pos. Median Heat Read Tucker Kraft (GB) $4,500 10.85 22.5 2 25% ~7% ⚠️ Eight-game sample Dalton Schultz (HOU) $3,400 8.26 17.0 3 16% ~7% 🔥 Strong Mason Taylor (NYJ) $2,800 4.46 14.0 2 15% ~7% ⚠️ Projection concern Dallas Goedert (PHI) $4,100 10.37 20.5 2 13% ~7% 🔥 Strong Oronde Gadsden (LAC) $3,500 5.94 17.5 2 13% ~7% 👀 Projection concern Colston Loveland (CHI) $5,300 12.18 26.5 2 12% ~7% 🔥 Supported David Njoku (LAC) $3,000 4.68 15.0 1 9% ~7% 👀 Cheap History Brock Bowers (LV) $6,900 18.12 34.5 1 8% ~7% Premium Ceiling Dalton Kincaid (BUF) $4,600 9.49 23.0 1 8% ~7% Strong 4x Support Cade Otton (TB) $3,700 7.79 18.5 1 7% ~7% At Median Harold Fannin (CLE) $4,200 11.24 21.0 1 6% ~7% Strong 4x Support Trey McBride (ARI) $6,800 15.55 34.0 1 6% ~7% Strong 4x Support Mark Andrews (BAL) $3,900 10.96 19.5 1 6% ~7% Strong 4x Support Juwan Johnson (NO) $3,700 9.56 18.5 1 6% ~7% Strong 4x Support TE Bottom Line
Schultz stands out because his 16% rate comes with three hits across 19 games, while Kraft owns the highest percentage with a smaller sample.
Tight end also offers several inexpensive paths to a manageable 5x target, which makes the position particularly interesting for salary allocation.
Historical Heat With a Current-Week Warning
A strong 5x history doesn't automatically make a player attractive this week.
This is where projection becomes useful.
Jeanty (LV) RB
Projection: 10.02
5x Target: 33
5x Rate: 12%
Two historical hits put him at double the RB median.
But reaching 33 points from a 10.02 projection requires an enormous jump beyond current expectation.
The history is strong. The Week 1 path is less convincing.
Travis Hunter (JAX) WR
Projection: 3.34
5x Target: 17
5x Rate: 14%
The historical rate is more than twice the WR median.
The projection is nowhere close to suggesting that type of workload or production is expected this week.
That's a major difference between historical possibility and current probability.
Mason Taylor (NYJ) TE
Projection: 4.46
5x Target: 14
5x Rate: 15%
Two 5x hits are meaningful.
A projection below five points makes the current path much thinner.
Oronde Gadsden (LAC) TE
Projection: 5.94
5x Target: 17.5
5x Rate: 13%
Again, the historical signal is legitimate.
The current projection creates a much wider gap between expectation and the slate-breaking target.
The Lesson
These players illustrate why The Heat Sheet shouldn't be sorted by 5x Hit Rate and treated as a ranking.
History tells us the ceiling has existed. Projection helps tell us how reasonable it is to pursue that ceiling this week.
Week 1 Heat Hierarchy
When hit rate, hit count, sample size, salary, target and projection are considered together, these are the profiles that stand out most clearly.
Strongest QB Heat
- Jordan Love (GB)
- Justin Herbert (LAC)
- Josh Allen (BUF)
All three have three historical 5x hits and rates between 17% and 19%.
Strongest RB Heat
- Gibbs (DET)
- Robinson (ATL)
- Taylor (IND)
Each has two 5x hits across 17 games with a 12% rate, double the RB median.
Strongest WR Heat
- Wan'Dale Robinson (TEN)
- Drake London (ATL)
- Quentin Johnston (LAC)
- Ja'Marr Chase (CIN)
- Amon-Ra St. Brown (DET)
- Michael Wilson (ARI)
- Xavier Hutchinson (HOU)
This is the deepest position for repeated, above-median 5x history.
Strongest TE Heat
- Dalton Schultz (HOU)
- Tucker Kraft (GB)
- Dallas Goedert (PHI)
- Colston Loveland (CHI)
Kraft owns the highest rate, while Schultz owns the strongest combination of hit count and sample size.
The Week 1 Heat Sheet Takeaways
Quarterback offers a clear ceiling tier
Love, Herbert and Allen each have three historical 5x performances, with rates more than twice or close to twice the positional median.
Premium running backs aren't lacking extreme upside
Gibbs, Robinson and Taylor have all reached demanding 5x targets multiple times despite their salaries.
Wide receiver provides the deepest 5x pool
There are multiple paths into extreme ceiling across every salary range, from Chase and St. Brown down to Johnston and Hutchinson.
Tight end may offer the most interesting salary flexibility
Schultz combines a $3,400 salary, a 17-point 5x target, three historical hits and a 16% rate across 19 games.
That's very different from simply choosing a cheap tight end because he fits the lineup.
Final Takeaway
The Heat Sheet isn't trying to predict exactly who reaches 5x this week.
It's identifying where slate-breaking salary-adjusted outcomes have already happened.
The strongest profiles aren't simply the highest percentages.
They combine:
Repeated 5x hits + above-position frequency + enough games to trust the signal + a Week 1 salary and projection that keep the ceiling relevant.
That's the foundation.
A projection tells us what's expected.
The Heat Sheet tells us which players have already proven they can travel far enough beyond expectation to produce the type of return large-field tournaments are ultimately built around.